I wrote a similar article three years ago, “Seasonal factors dominate stock rise and fall” You can click and refer to that article I wrote three years ago.
Historical data speaks for itself
Dow Jones Industrial Average Statistics
Since the Dow Jones Industrial Average’s inception in the late 1890s, the average September return has been a loss of 1.1%. Comparable
Below that, the average return in the other 11 months was a profit of 0.8%.
According to data from the Dow Jones Data Group, September is the worst month in the history of U.S. stocks. Since its inception in 1928, 55% of the S&P 500 index has fallen in September, and the average performance over the years is a decline of 1.01%.
The Dow Jones Industrial Average, which is dominated by blue-chip stocks, has had a similarly bad performance in September in history, falling 70 times in 127 years, with an average decline of 1.03%. The Nasdaq isn’t much better, falling 45% of the time since its inception in 1971, with an average loss of 0.49%. As shown in Figure 1 below.
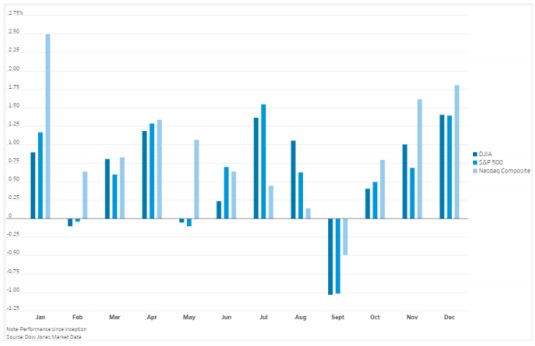
Since 1937, the S&P 500 and Dow Jones Industrial Average have fallen an average of 1% in September, while the Nasdaq has fallen an average of 0.5%, according to Dow Jones Market Data.
Wind’s statistical
Wind data shows (shown in Figure 2 below) that since 1928, the S&P 500 has fallen an average of 1.2% in September. Except for February and September, the S&P 500 Index achieved positive returns in the remaining 10 months.

LPL Financial’s statistical
Since 1950, the S&P 500 has risen only 43% of the time in September, making it the worst month for stocks, said Adam Turnquist, technical strategist at LPL Financial.
Citi’s statistics
A Citigroup analysis of data going back to 1928 shows that the S&P 500’s average realized volatility in September has historically been 1.5 points higher than in August, while it was 2.5 points higher in October.
Probable cause
No one can find a convincing reason
Larry Tint, chairman of Quantal International, said: “If a convincing explanation for the September effect is found… the historical pattern will soon disappear.“
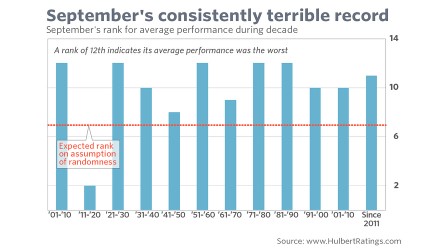
As you can see below in Figure 3 (Ranking of September Compensation by Twelve Months, Years Since the Late 1800s), over the course of the dozen years since the late 1800s, September performance was below average in all but one decade. For more than half of those decades, it ranked 11th or 12th in average monthly performance rankings.
Does this poor track record mean you should sell your stocks in September? The answer is “no one dares to be completely sure.”
While September’s record was terrible, the poor statistics alone are not enough reason to change the portfolio. After all, correlation is not causation. And, despite Wall Street’s best efforts, there’s still no reasonable explanation for September’s poor record.
Can’t be explained by coincidence
No matter how you slice it, September was a bad month for U.S. stocks.
Moreover, September’s disappointing record isn’t just the result of a few particularly bad years. On the contrary, the stock market performance in September is usually near or dropped to the bottom of the rankings.
Over the nearly 12-decade period since 1900, average September performance has been below average 11 times per decade.
He even fell to the bottom of the 12th place 5 times and 11th place once.
Wall Street’s guess
Wall Street offered three explanations for the stock market’s poor performance in September:
- Investors are more inclined to sell stocks after the summer holidays.
- Many mutual funds’ fiscal years end on September 30, which gives them a chance to sweeten their books in September.
- Investors were forced to sell stocks in September to finance their children’s high school fees.
September is also the wrap-up for Season 3. Many investors will use this period to re-examine and realign their portfolios. Important news surrounding taxation and corporate outlook adjustments before the end of the year may affect the direction of the stock market and bring about volatility.
It’s very different in an election year
Statistically speaking from past statistics, the U.S. midterm elections are expected to reduce the tendency of the stock market to fall. Stock trader Jeff Hirsch said that since 1950, U.S. stocks have risen an average of 3.84% in September of midterm election years, which is a rare positive message in September data.
Related articles
- “Only September had negative returns in past century“
- “Seasonal factors dominate stock rise and fall“
Disclaimer
- The content of this site is the author’s personal opinions and is for reference only. I am not responsible for the correctness, opinions, and immediacy of the content and information of the article. Readers must make their own judgments.
- I shall not be liable for any damages or other legal liabilities for the direct or indirect losses caused by the readers’ direct or indirect reliance on and reference to the information on this site, or all the responsibilities arising therefrom, as a result of any investment behavior.