The value of past data
First of all, I must emphasize again that any past performance of the stock market cannot guarantee future performance, nor does it mean that it will definitely be born again.
However, the stock market is a place where the will of the people gathers, and historical experience still has a certain degree of reference value; because all scenarios will change, but human nature will not change.
The S&P 500 in 2022
The S&P 500 index is down 19.4% in 2022, compared to only six years since 1928 that have seen losses of more than 20%. By definition, a stock market decline of more than 20% loss represents a bear market.
In 2022, the S&P 500 only had 100 days of rising trading days, the fewest year since 1976.
Negative return for two consecutive years
According to the statistics of U.S. stocks in the past 100 years, the S&P 500 has experienced negative returns for two consecutive years, only four times. These four times are super economic events that can be recorded in history:
- 2000-2002: negative return for 3 consecutive years, dotcom bubble crash.
- 1973-1974: negative return for 2 consecutive years, After the collapse of the Bretton Woods system, the oil crisis exacerbated the stock market decline, the 1973-1975 recession, a period of economic stagnation in much of the Western world, ended the overall post-World War II economic expansion.
- 1946-1948: negative return for 3 consecutive years, after World War II, pent-up demand leads to inflation and unemployment.
- 1939-1941: negative return for 3 consecutive years, World War II.
- 1929-1932: negative return for 4 consecutive years, the Great Depression.
In other words, except for these four years, as long as the S&P 500 Index has a negative return in one year, it must have a positive return in the following year.
The most recent one was during the dotcom crash. From 2000 to 2002, the S&P 500 index had negative returns for three consecutive years. It happened to coincide with the 9/11 attack when the United States was first attacked, making the crash last for about three years. The three-year crash has severely damaged the vitality of US stocks and set two records:
- From 2001 to 2010, the ten-year annualized rate of return of the S&P 500 was an unbelievably negative 0.45%! Let’s not forget, there was a financial tsunami in 2008 and 2009; this means that the stock market was in a period of collapse for four years in this decade.
- The Nasdaq index will have to wait until 2015 to return to its pre-dotcom high.
The detail graphics
Figure one: S&P 500 Annual returns (1928 – 2022)
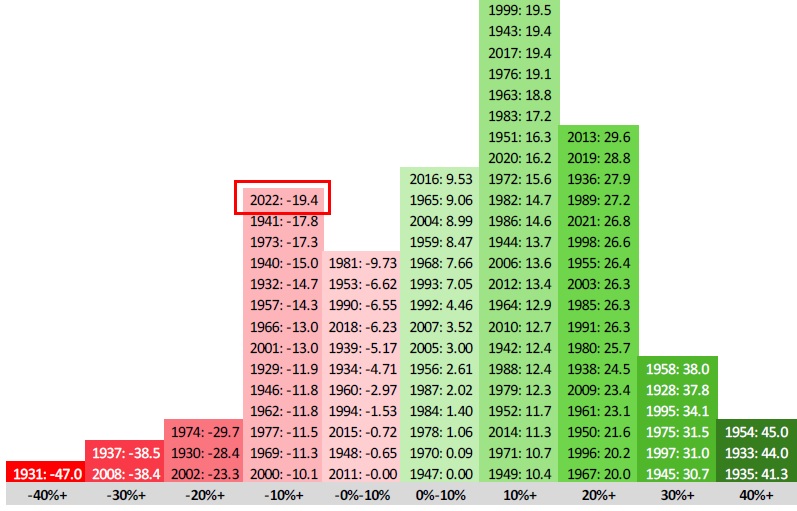
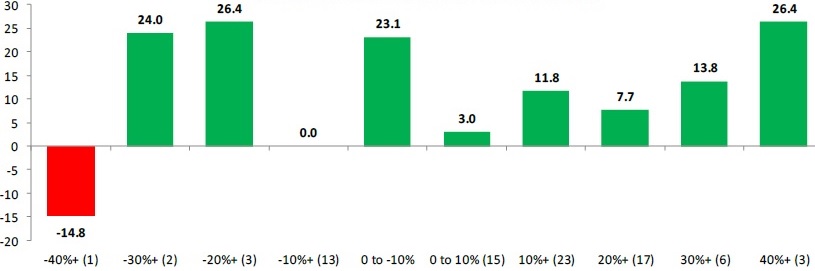
Figure two: S&P 500 Average return in the following years (1928 – 2022)
Related articles
- “S&P 500 index next year performance, based on last century record“
- “S&P 500 bull return in a row, what will happen next, based on past century data“
- “Global stock markets performance comparision over the past 30 years in a table“
- “Return rate comparison among Buffett portfolio, Berkshire stock price, S&P 500 over the years“
- “2022 S&P 500 Constitutent Stocks Performance“
- “Stocks Better than the S&P 500, Procter & Gamble (P&G)
- “S&P 500 vs. Nasdaq 100 index, how to choose a market index?“
- “S&P 500 index, the only stock worth holding forever“
- “Querier to Annualized rate of return for S&P 500 Index“
- “S&P 500 P/E ratio has been rising in the past century, S&P 500 PE Ratio and Average Querier“
- “A table comparing S&P 500, Nasdaq, Dow Jones, Philadelphia Semiconductor Index over the years since its inception and annualized returns“
- “Investors should care annualized rate of return (IRR), How to calculate?“
- “Why most investors should invest ETFs tracking broad market?“
- “US issued ETFs tracking US market is your best bet“
- “Top 10 ETFs and important major US stock market index“
- “Disadvantages of ETF investment“
- “Any strong reason to buy mutual fund?“
Disclaimer
- The content of this site is the author’s personal opinions and is for reference only. I am not responsible for the correctness, opinions, and immediacy of the content and information of the article. Readers must make their own judgments.
- I shall not be liable for any damages or other legal liabilities for the direct or indirect losses caused by the readers’ direct or indirect reliance on and reference to the information on this site, or all the responsibilities arising therefrom, as a result of any investment behavior.