Introduction
Company profile
Merck (ticker: MRK) Since the mid-20th century, Merck, a component of the Dow Jones Index, has been the top pharmaceutical company because Merck spends more on research and development than other companies. While Merck occasionally loses to companies with hot new drugs (such as Pfizer’s Viagra), or sales to related competitors with significant nonpharmaceutical businesses.
Spun off Organon
In 2022, Merck spun off a $6.5 billion business into a new public company, Organon (ticker: OGN), including women’s health products and biosimilars, a move allows Merck to focus on high-growth areas such as cancer drugs and vaccines. After the spin-off, Ogallon will be responsible for the management of the drug’s post-market life cycle, while Merck will focus on drug research and development.
Merck’s most famous drug
But all in all, Merck is a long-term investment target that can stand the test of time due to its wide product line and stable revenue. Its most famous drug is Keytruda, a monoclonal antibody that boosts the body’s immunity by boosting T-cell immune responses and is used to treat patients with unresectable or metastatic melanoma. This oncology drug is the fourth-largest drug in the world by revenue in 2021.
Business performance and share price
2021 Revenue Breakdown of Each Division
| Pharmaceutical | Area | Product name | Revenue ($ million) | Annual growth rate |
| Oncology | 18,879 | 20.36% | ||
| Keytruda | 17,186 | 19.51% | ||
| Alliance revenue – Lynparza | 989 | 36.41% | ||
| Alliance revenue – Lenvima | 704 | 21.38% | ||
| Vaccines | 9,687 | 23.09% | ||
| Gardasil/Gardasil 9 | 5,673 | 44.06% | ||
| ProQuad/M-M-R II/Varivax | 2,135 | 13.68% | ||
| Pneumovax 23 | 893 | -17.85% | ||
| RotaTeq | 807 | 1.25% | ||
| Vaqta | 179 | 5.29% | ||
| Hospital Acute Care | 2,833 | 8.42% | ||
| Bridion | 1,532 | 27.88% | ||
| Prevymis | 370 | 31.67% | ||
| Primaxin | 259 | 3.19% | ||
| Noxafil | 259 | -21.28% | ||
| Cancidas | 212 | -0.47% | ||
| Invanz | 202 | -4.27% | ||
| Zerbaxa | -1 | -100.77% | ||
| Immunology | 1,124 | -3.77% | ||
| Simponi | 825 | -1.55% | ||
| Remicade | 299 | -9.39% | ||
| Neuroscience | 318 | -2.75% | ||
| Belsomra | 318 | -2.75% | ||
| Virology | 1,721 | 100.82% | ||
| Molnupiravir | 952 | 100.00% | ||
| Isentress/Isentress HD | 769 | -10.27% | ||
| Cardiovascular | 594 | 18.56% | ||
| Alliance revenue – Adempas/Verquvo | 342 | 21.71% | ||
| Adempas | 252 | 14.55% | ||
| Diabetes | 7,598 | 0.12% | ||
| Januvia | 3,324 | 0.54% | ||
| Janumet | 1,964 | -0.36% | ||
| Other pharmaceutical | 2,310 | -0.09% | ||
| Total Pharmaceutical segment sales | 42,754 | 16.78% | ||
| Animal Health: | ||||
| Livestock | 3,295 | 12.11% | ||
| Companion Animals | 2,273 | 28.85% | ||
| Total Animal Health segment sales | 5,568 | 18.39% | ||
| Other segment sales | – | -100.00% | ||
| Total segment sales | 48,322 | 16.90% | ||
| Other | 382 | 109.89% | ||
| Total Company Revenue | 48,704 | 17.31% |
Current stock valuation
| 6/23/2022 | Merck |
| Market capitalization ($ billion) | 225.469 |
| Share price | 86.16 |
| P/E | 15.96 |
| Dividend yield | 3.26% |
| Stock performance in past 5 years (S&P 500 was+65.13%) | +41.32% |
How is the performance vs. peers?
business performance comparison
In 2021, Johnson’s and Johnson’s, Abbvie, Merck and Pfizer’s business performance are shown in below table, respectively.
| Index | JNJ | PFE | ABBV | MRK |
| 2021 total revenue ($ billion) | 93.775 +13.55% | 81.288 +95% | 56.197 +22.69% | 48.704 +17.31% |
| Pharmaceuticals | 52.08 +14.28% | 79.557+95% | 56.197 +22.69% | 48.704 +17.31% |
| Medical devices / Pfizer is CDMO | 27.06 +17.86% | 1.731 +87% | 0 | 0 |
| Nutrition | 14.645 +4.1% | 0 | Spin off as Abbott | Spin off as Organon |
| Gross margin | 68.27% | 62.28% | 69.65% | 72.81% |
| Operating margin | 26.92% | 33.02% | 35.29% | 32.56% |
| Net margin | 22.26% | 27.04% | 22% | 26.79% |

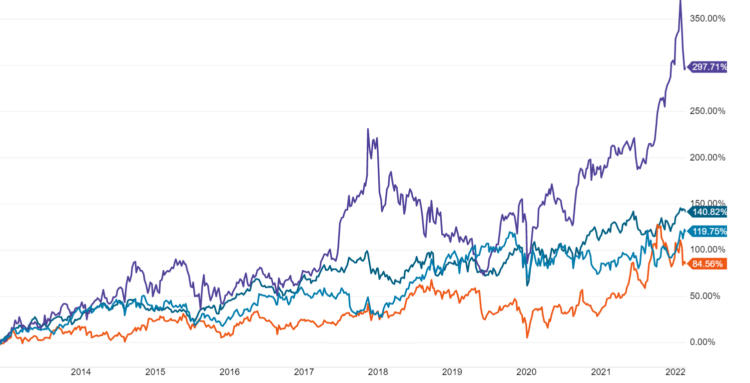
Stock price comparison
In the past 10 years, the stock prices of Johnson & Johnson, Pfizer, Merck, and AbbVie, as shown in the chart below, have risen by 119.75%, 46.11%, 84.56%, 140.82%, and 297.71%, respectively.
Stock performance comparision
| | JNJ | PFE | ABBV | MRK |
| Market captalization (billion) | 474.54 | 277.14 | 259.43 | 221.61 |
| Share price | 180.46 | 49.07 | 146.88 | 87.65 |
| P/E | 24.31 | 12.5 | 22.76 | 15.68 |
| P/S | 5.08 | 3.51 | 4.91 | 4.1 |
| Dividend yield | 2.5% | 3.26% | 3.84% | 3.15% |
Related articles
- “How does HCA Healthcare make money?“
- “Akeso’s lung cancer drug beat world best-selling drug, a biotech DeepSeek watershed“
- “Chinese biotech begins to show its DeepSeek moment“
- “Weight loss is the future golden goose of the drug market “
- “World’s first gene editing therapy Casgevy finally approved“
- “How does CRISPR, the gene editing inventor, make money?“
- “Gilead, lord of antiviral drug, reveals world’s first AIDS vaccine“
- “Viking is developing two future star new drugs at the same time“
- “FDA approved first ever MASH drug“
- “Viking is developing two future star new drugs at the same time“
- “Alzheimer, the only major disease yet to be conquered, current progress and related companies“
- “Why Eli Lilly become global pharmaceutical market value king?“
- “Big pharma spin-offs, and advantages to invest them“
- “Eli Lilly, a big pharma with astonishing valuation“
- “Pfizer, the world’s largest pharmaceutical company“
- “Novo Nordisk’s new diabetes drug Semaglutide,Ozempic,Wegovy and Mounjaro found to have surprising weight-loss effects“
- “The next No. 1 pharmaceutical leader AbbVie“
- “How does rising biotech Vertex make money?“
- “Stable Dow Component Merck, how does it make money?“
- “The ex-largest pharma Merck“
- “Abbott, the world’s most important medical device and nutritional food supplier, how does it make money?“
- “Roche, the king of anti-cancer“
- “How the best AAA credit rating Johnson & Johnson makes money?“
- “How does dominated Intuitive Surgical make money?”
Disclaimer
- The content of this site is the author’s personal opinions and is for reference only. I am not responsible for the correctness, opinions, and immediacy of the content and information of the article. Readers must make their own judgments.
- I shall not be liable for any damages or other legal liabilities for the direct or indirect losses caused by the readers’ direct or indirect reliance on and reference to the information on this site, or all the responsibilities arising therefrom, as a result of any investment behavior.