The S&P 500 index represents US stocks
Since the launch of the S&P 500 by Standard & Poor’s, it has gradually been accepteded globally as a representative of the market returns of U.S. stocks market. Therefore, not only in US stocks, the S&P 500 can be said to be the most important market index for the world’s financial market. Welcome to my two previous related articles “S&P 500 index, the only stock worth holding forever” and “A table comparing S&P 500, Nasdaq, Dow Jones, Philadelphia Semiconductor Index over the years since its inception and annualized returns“.
You can use the “Querier to Annualized rate of return for S&P 500 Index” provided on this site to query the historical return rate of the S&P 500 index for each year, as well as the S&P 500 index for any two years
S&P 500 P/E ratio is rising
If you look closely at the average price-to-earnings ratio of the S&P 500 index, which represents the U.S. stock market over the past hundred years, generated by this queryer, you can immediately find (It is recommended that you use your finger to zoom in on the pink trend chart below on your mobile phone, or press the CTRL key and the scroll button on the mouse simultaneously on the computer to zoom in on the chart):
- The price-earnings ratio valuation of U.S. stocks has a clear and slow upward trend with the years.
- The average price-to-earnings ratio of the S&P 500 index in the past 100 years is 17.12, but in 2022, even if it is currently in a bear market, the S&P 500 index will be in:
- The average PE ratio for 09/02/2022 is 19.94
- The average PE ratio for 01/02/2022 is 23.11
And the numbers for 2021:
- The average P/E ratio on 6/30/2021 is 45.65
- The average PE ratio for 01/02/2021 is 35.96
Features of this Querier
S&P 500 PE Ratio and Average Querier provides below features:
- It can be used to query the average annual price-earnings ratio of the S&P 500 for any two years in the past 100 years.
- If you enter the same number for starting year and ending year, you can check the annual price-earnings ratio of the S&P 500 for that year.
- At the bottom, the annual price-earnings ratio chart of the S&P 500 index over the past 100 years will be displayed, and the annual price-earnings ratio of the S&P 500 index of the year can be displayed by sliding the mouse over the small blue circle in the chart.
One thing to note first, the annual price-to-earnings ratios for the S&P 500 that I use are based on the twelve-month average of the S&P 500 for that year.
How to use this querier?
Users simply click on this link to connect to the S&P 500 PE Ratio and Average Querier and see the following screen:
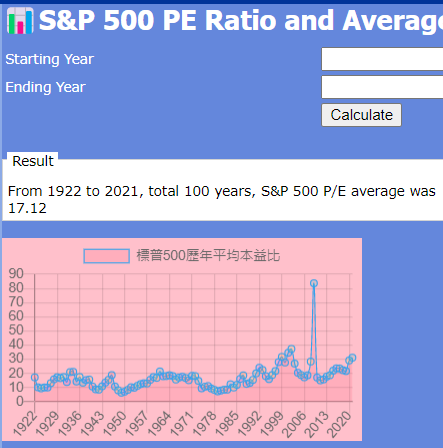
The user only needs to enter the following two fields on the screen:
- Starting Year: For example, in the example in the screen, we enter 1922
- Ending Year: For example, in the example in the screen, we enter 2021
After the input, click the “Calculate” button on the screen, and you can see the querry results in the “Results” area.
Current P/E Ratio
Take December 2022 as an example, about half of the companies have a price-to-earnings ratio of less than 14 times, and even a price-to-earnings ratio of less than 8 times is not uncommon.
Table for US stock investment toolset
Special reminder
For all major market index annualized return query tools listed in the table; including Taiwan Stock Index, Dow Jones Index, S&P 500 Index, Nasdaq Index, Philadelphia Semiconductor Index, not only annualized return query , you can also query the index return rate in any year──just enter the year you want to query in both the start and end fields.
The following is a list of must-have US stock investment free tools developed by Andy Lin:
For the detail, please see “Free online US stock investment toolset".
Related articles
- “Software PE ratio is about twice that of hardware. What is the basis? “
- “Global stock markets performance comparision over the past 30 years in a table“
- “S&P 500 bull return in a row, what will happen next, based on past century data“
- “S&P 500 index next year performance, based on last century record“
- “Return rate comparison among Buffett portfolio, Berkshire stock price, S&P 500 over the years“
- “2022 S&P 500 Constitutent Stocks Performance“
- “Stocks Better than the S&P 500, Procter & Gamble (P&G)
- “S&P 500 vs. Nasdaq 100 index, how to choose a market index?“
- “S&P 500 index, the only stock worth holding forever“
- “Querier to Annualized rate of return for S&P 500 Index“
- “S&P 500 P/E ratio has been rising in the past century, S&P 500 PE Ratio and Average Querier“
- “A table comparing S&P 500, Nasdaq, Dow Jones, Philadelphia Semiconductor Index over the years since its inception and annualized returns“
- “Investors should care annualized rate of return (IRR), How to calculate?“
- “Most investors should invest ETFs tracking broader market“
- “US issued ETFs tracking US market is your best bet“
- “Top 10 ETFs and important major US stock market index“
- “Querier to Annualized rate of return for Taiwan Stock Exchange“
Disclaimer
- The content of this site is the author’s personal opinions and is for reference only. I am not responsible for the correctness, opinions, and immediacy of the content and information of the article. Readers must make their own judgments.
- I shall not be liable for any damages or other legal liabilities for the direct or indirect losses caused by the readers’ direct or indirect reliance on and reference to the information on this site, or all the responsibilities arising therefrom, as a result of any investment behavior.