TSMC discussion in my books
I have discussed the company Nvidia (ticker:NVDA) in two recent books; including:
In my book “The Rules of Super Growth Stocks Investing“:
- Sections 2-4, the entire section is dedicated to introducing the company TSMC
- Section 3-3, analyze the business development of technology companies to grasp the pulse of key industries
In my book “The Rules of 10 Baggers“:
- Section 3-2, the entire section is dedicated to introducing TSMC and the global semiconductor supply chain.
The goal of this article
I know that most people hate mathematical formulas, hate complicated calculations, don’t want to read the theory, and don’t want to understand the reasons. Therefore, we will use the simplest method to calculate the intrinsic value of TSMC’s Discounted Cash Flow (DCF) – just fill in a few necessary numbers (these numbers are available on famous financial websites). The same method can be applied repeatedly to estimate the DCF intrinsic value of any stock you are interested in.
Again, because most investors don’t want to read long articles or figure out complex calculations, the estimates and algorithms in this article are simplified numbers for readers to quickly understand. If you want to learn more about the calculation of the intrinsic value of the discounted cash flow method (DCF) and a more accurate algorithm, you can refer to the detailed instructions on pages 330~337 of my book “The Rules of Super Growth Stocks Investing“, as well as the detailed instructions in the book Step-by-step calculation explanation of practical examples.
Tool used
In order to allow investors to easily apply to the stocks they are interested in, to repeatedly calculate the TSMC DCF numers mentioned in this post, and to facilitate the explanations in my post, I will use a free online tool program developed and written by myself─── Discounted Cash Flow (DCF) Calculator.
For a detailed explanation and introduction to the Discounted Cash Flow (DCF) Calculator I developed and written, please see the introduction to my previous post “DCF (Discounted Cash Flow) Calculator“. If you want to know the details, assumptions, parameter settings, mathematical formulas, and related more detailed explanations of this Discounted Cash Flow (DCF) Calculator, please refer to page 330 to 337 of my book “The Rules of Super Growth Stocks Investing” for the detailed instructions, as well as step-by-step calculation explanations of practical examples mentioned in the book.
Fundamental numbers
Then use the discounted cash flow method to estimate, What’s TSMC DCF intrinsic value?
First, a formula review: Free Cash Flow = Operating Cash Flow – Capital Expenditures
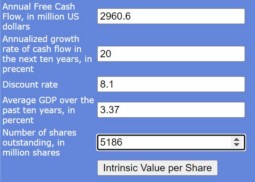
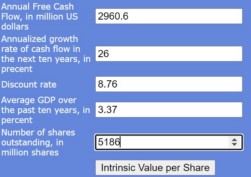
The key numbers used in discounted cash flow calculation are as follows:
- In the past twelve months, TSMC’s unlevered free cash flow was US$2.9606 billion; leveraged free cash flow was US$2.7201 billion. We adopt the most optimistic estimate and take the unlevered free cash flow of US$2.9606 billion as free cash flow.
- According to the speech of TSMC’s CEO at the TSMC shareholders’ meeting in July 2023: In the next five years, it is possible for revenue to maintain an annual growth rate of 15% to 20% by 2030. At the conference in January 2024, the CEO stated that TSMC will grow quarter by quarter in 2024, and its full-year US dollar revenue will grow by 24%-26% annually. We adopt the most optimistic estimate of 26%. Moreover, over the past 10 years, TSMC’s free cash flow has averaged an annual growth rate of 20.90%. Combining these two data, 26% is the most optimistic value.
- Number of shares outstanding at the end of 2022: 5,185,840,000 shares.
- Taiwan’s average GDP growth rate over the past ten years is 3.37%, which is regarded as the sustainable growth rate.
- TSMC is a stable large enterprise. The average weighted average cost of capital (WACC) over the past ten years is 8.76%, and 8.76% is used as the discount rate.
Note: This calculation was completed in themiddle of Febuary 2024.
Number for DCF calculator
For detailed instructions on filling in the values in each field, please see the introduction to my previous post “DCF (Discounted Cash Flow) Calculator“. For a more detailed explanation, please see the detailed explanations on pages 330~337 of my book “”The Rules of Super Growth Stocks Investing“, as well as the step-by-step calculation of practical examples.
Calculation results
Calculation Results from “DCF (Discounted Cash Flow) Calculator” is:
10th year perpetual value discounted to present value $572652.2 US Dollars
Discounted cash flows for all future ten years to present value $72600.3 US Dollars
ShareholdersEquity $645252.5 US Dollars
Intrinsic value per share $124.42 US Dollars
If you still have doubts, you can use the “DCF (Discounted Cash Flow) Calculator” formula designed on my website to calculate the intrinsic value of TSMC. It is only US$124.42–most of TSMC’s Shareholders must be fascinated by such a result (not surprising, because it is human nature). Of course, the discounted cash flow method is just a valuation method, and it is not necessarily correct. Otherwise, how could the current stock price of TSMC be US$100?
Why DCF result is different from market price?
However, as most professional investors on Wall Street, even Buffett agree that the discounted cash flow method is the most scientific and closest to the intrinsic value of most listed companies. The discounted cash flow method is still representative.
Note: I would like to reiterate again: The discounted cash flow method is only one of many stock valuation methods. There are many factors that affect the stock price, and the stock price of individual stocks will change dynamically with the market and various factors, and will not be a fixed value. Investors should also be reminded not to use only one valuation model for valuation.
Why is TSMC’s valuation lower?
So why does TSMC’s stock price calculated using the discounted cash flow method be US$124.42? The main reason is that TSMC’s free cash flow is too low. Of course there are other factors, and I will write another article next week to put forward my own opinions.
I understand that investors, especially those holding TSMC’s Taiwanese stocks and US stocks, have long complained that TSMC’s valuation is low. What are the possible reasons? Interested investors can refer to my analysis in my post “Why is TSMC valuation much lower than U.S. peers?”.
Table for US stock investment toolset
Special reminder
For all major market index annualized return query tools listed in the table; including Taiwan Stock Index, Dow Jones Index, S&P 500 Index, Nasdaq Index, Philadelphia Semiconductor Index, not only annualized return query , you can also query the index return rate in any year──just enter the year you want to query in both the start and end fields.
The following is a list of must-have US stock investment free tools developed by Andy Lin:
For the detail, please see “Free online US stock investment toolset".
I am the author of the original text, the essence of this story was originally featured on Smart Magazine, Issue of March 2004
Related articles
- “SK Hynix dominates memory by AI“
- “TSMC has notorious tracking record of violating Labor Law“
- “TSMC CEO appalling remarks on Chinese robots, inferiority to nVidia Huang“
- “SkyWater, 3D chip leader and the only pure-play US chip foundry“
- “Morris Chang refuted by Yeh Wanan, Taiwan was unwilling to invest in TSMC“
- “What does book “Chip War” talk about?“
- “The importance of cash, Apple’s experience in using cash“
- “How important is semiconductor industry to Taiwan?“
- “How was TSMC originally founded? Not by Morris Chang“
- “TSMC risks and disadvantages in Taiwan“
- “TSMC Morris Chang’s controversial words and deeds“
- “165 billions investment proved TSMC moat and competitiveness is fragile“
- “TSMC Advanced Packaging Evolution History“
- “TSMC is becoming the lord of semiconductor packaging, in addition to foundry“
- “Taiwan’s abandoned nuclear hit TSMC hard, profit margins decrease 1% by electricity price increase“
- “What are silicon photonics? Why it’s important? and current progress“
- “Rapidus will be TSMC’s strongest rival in the future“
- “How does Onto make money? Advanced packaging beneficiary“
- “Mong-Song Liang, the hero of SMIC’s breakthrough in US blockade“
- “What’s TSMC DCF intrinsic value?How to calculate it quickly with a free tool?“
- “DCF (Discounted Cash Flow) Calculator“
- “Why is TSMC valuation much lower than US peers?“
- “Valuation methods significant different between US and Taiwan investors“
- “Taiwan vs US stock market – For Taiwanese stock investors investing in US stocks“
- “Is Buffett no longer hold for long haul? TSMC, HP, and US Bancorp cases study“
- “TSMC negative corp culture and management style are detrimental to its future and growth“
- “Four chip companies account for one-third of S&P 500 gains so far this year
- “Top five lucrative artificial lucrative intelligence listed companies“
- “What’s TSMC DCF intrinsic value?How to calculate it quickly with a free tool?“
- “How many fabs and houses does TSMC have currently and in the future?“
- “Comparison of TSMC, Samsung, Intel’s Yield and Advanced Process“
- “The TSMC cost, sell price, and R&D cost of chip foundry“
- “ASML, who dominate TSMC’s fate“
- “Comparison of SMIC, Rapidus, TSMC, Intel, and Samsung’s new process roadmaps for future chips“
- “Two long-term threats to TSMC: US and SMIC“
- “Why is TSMC’s profit margin much greater than competitors?“
- “How does TSMC make money?“
- “Zyvex and sub-nanometer semiconductor processes, will Zyvex threat TSMC?“
- “TSMC gets emerging and serious challenges“
- “How does nVidia make money, Nvidia is changing the gaming rules“
- “The reasons for Nvidia’s monopoly and the challenges it faces“
- “Why nVidia failed to acquire ARM?“
- “Revisiting Nvidia: The Absolute Leader in Artificial Intelligence, Data Center, and Graphics“
- “How does Intel make money? and the benefits to invest in it“
- “Intel’s current difficult dilemma“
- “How does Micron make money? What investors should know?“
- “How does Texas Instruments make money? Amazing long term capital reward and company net profit margin!“
- “How AMD makes money? A rare case of turning defeat into victory“
- “Why is AMD’s performance so jaw-dropping?“
- “Qualcomm diversifies success, no nonger highly dependend on phone“
- “How does the ubiquitous Arm make money?“
- “Significant changes in Broadcom’s business approach“
- “Data center, a rapidly growing semiconductor field“
- “How does Applied Materials, lord of semiconductor equipment, make money?“
- “How does Applied Materials, lord of semiconductor equipment, make money?“
- “How does Lam Research, top chip equipment player, make money?“
- “The lucrative semiconductor supply chain“
- “Global semiconductor chip market in detail, big dominators and markets“
- “6 common wrong semiconductor investment myths“
- “Gen 3 semiconductor“
- “Three EDA oligopoly vendors: Synopsys, Cadence, and Mentor Graphics“
- “How does, the EDA oligopoly, Cadence make money?“
- “How does Synopsis, the EDA oligopoly, make money?“
Disclaimer
- The content of this site is the author’s personal opinions and is for reference only. I am not responsible for the correctness, opinions, and immediacy of the content and information of the article. Readers must make their own judgments.
- I shall not be liable for any damages or other legal liabilities for the direct or indirect losses caused by the readers’ direct or indirect reliance on and reference to the information on this site, or all the responsibilities arising therefrom, as a result of any investment behavior.